|
|
Dashboard
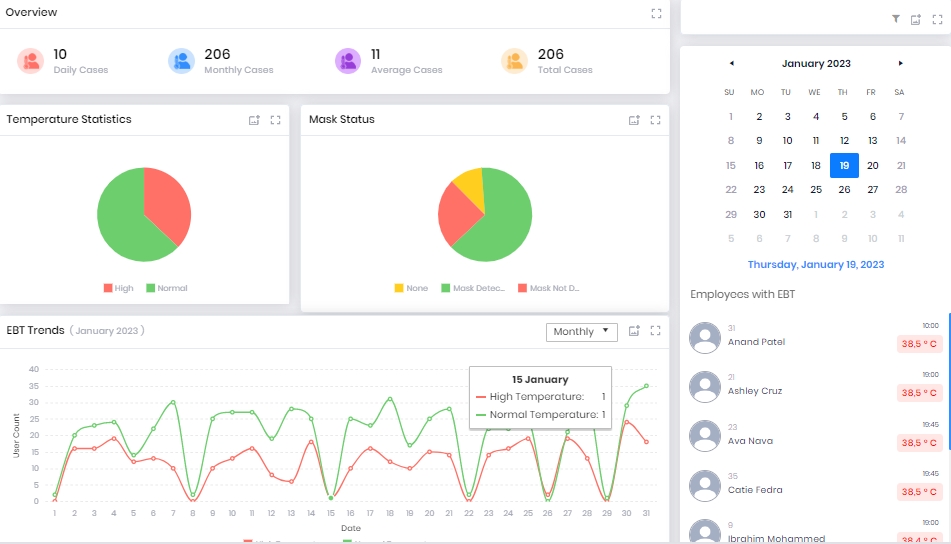
The Dashboard tab allows monitoring of Employee's Elevated Body Temperature (EBT) events.
Screen Layout of Dashboard
Field Description of Dashboard
The various dashboards are described below:
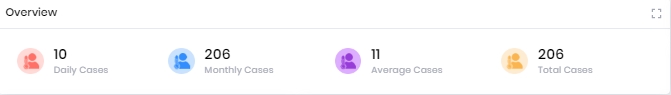
Overview:
This section displays the following data on the dashboard:
-
Daily Cases
EBT detected employee count for the selected day.
-
Monthly Cases
EBT detected employee count for the selected month.
-
Average Cases
Average EBT detected employees per day. Distinct cases per number of days.
-
Total Cases
Total number of employees that have been detected with EBT.
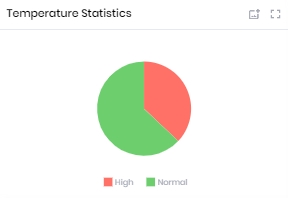
Temperature Statistics:
The daily statistics dashboard includes a pie chart of EBT readings, normal temperature readings, and high temperature readings. Hover the mouse over the pie chart to view the number of Employees with normal temperature or high temperature.
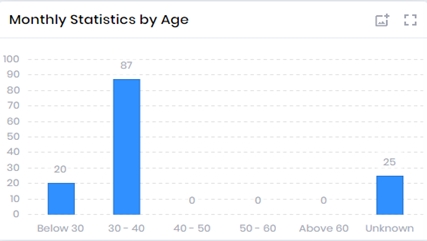
Monthly Statistics by Age:

|
This section will be displayed on the Dashboard when Mask Data is not available. |
This section displays the number of Employees with an EBT detected by age every month. The age range can be configured from the EBT settings.
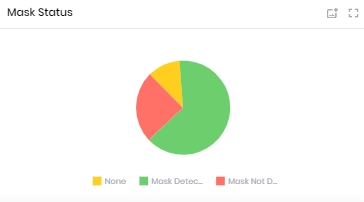
Mask Status:
This section displays a pie chart of number of Employees with mask detected, mast not detected and none. Hover the mouse over the pie chart to view the number of Employees with mask detected, or mask not detected or none.
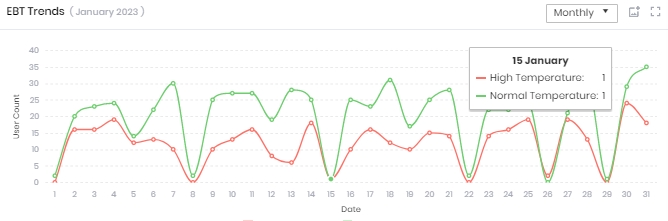
EBT Trends:
You can view monthly or weekly EBT trends from the Dashboard.
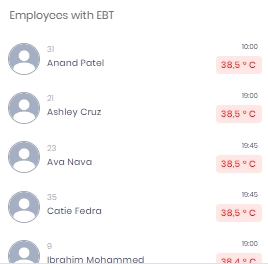
Employees with EBT:
Displays a list of EBT detected employees with a hyperlink to the Employee Analytics screen.